Receive quick, reliable project information with our enhanced Report Generator. The new design and increased functionality enable your team to access accurate project metrics through pie, bar and our new dual-bar charts.
By utilizing these reports, your team can now easily provide tactical and strategic project metrics to management to review.
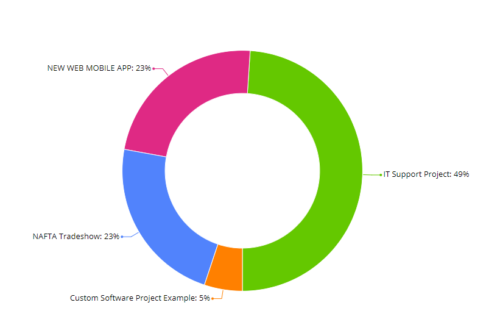
Enhanced Pie and Bar Charts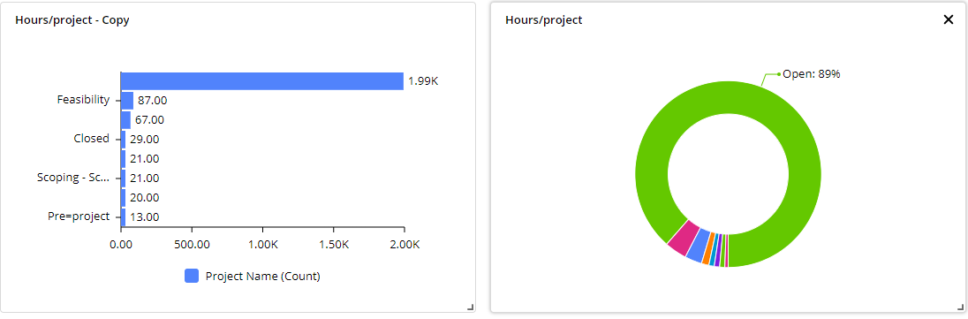
The enhanced design of the bar and pie charts clearly displays data so your team can better understand the metrics they are reviewing. The other updates include:
- The layout now displays larger amounts of data for better visibility
- Improved labeling system for more transparent data categorization
- New tooltip capability provides access to precise values, simply hover your mouse over any data point
- Pie charts now have a new color scheme to display information more clearly
New Dual-Bar Chart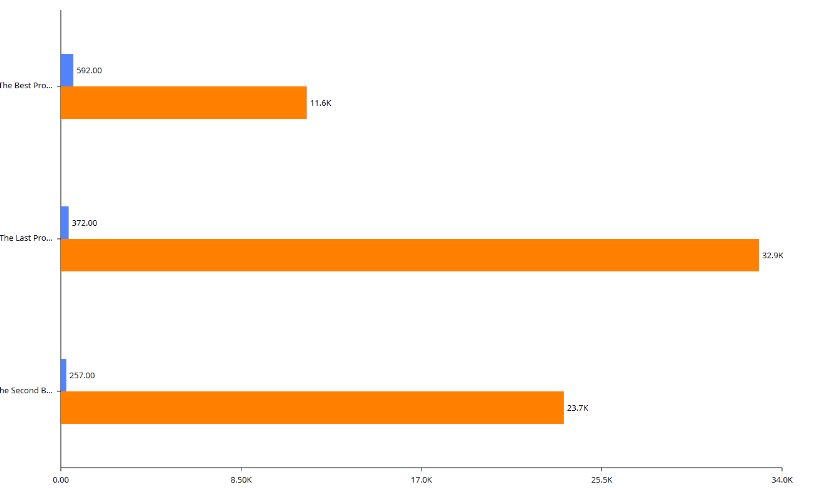
The new dual bar chart has the ability to compare two values side by side per category. This new feature gives users the ability to easily compare different metrics all in one intuitive report.
Easy Projects is constantly enhancing our software and launching new features to better assist our clients′ needs. You can stay updated on these announcements by checking our blog frequently!
Follow us
