
We are very excited to present our latest update to Easy Projects: totally redesigned and improved Report Generator.
Here are the major highlights of the new version...
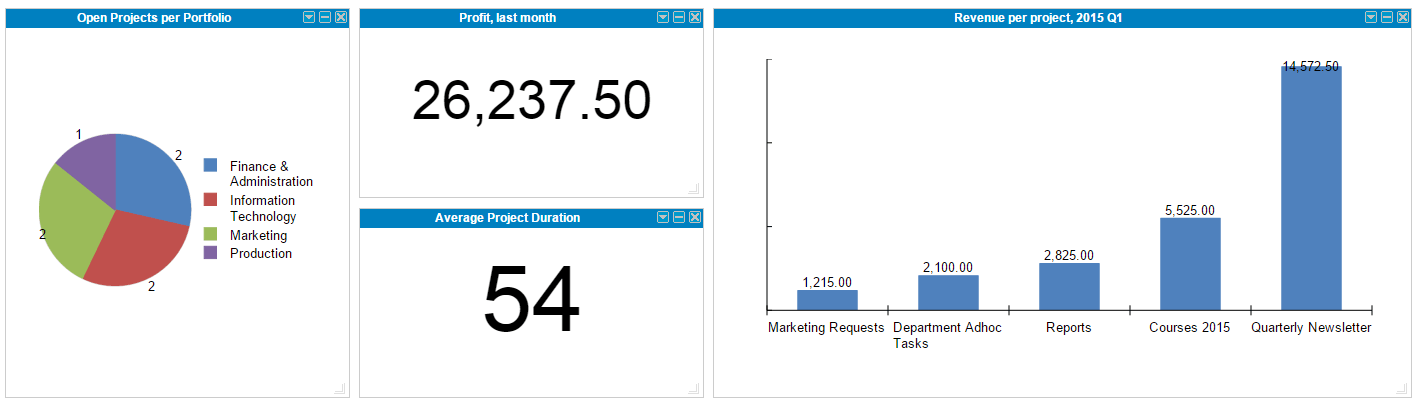
New report types: Bar Chart, Pie Chart, Metric
In addition to a regular table report, it′s now possible to create bar charts, pie charts or metrics as your reports.
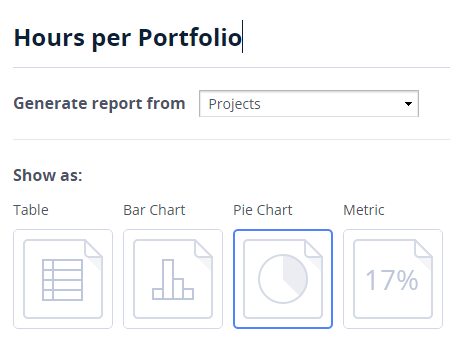
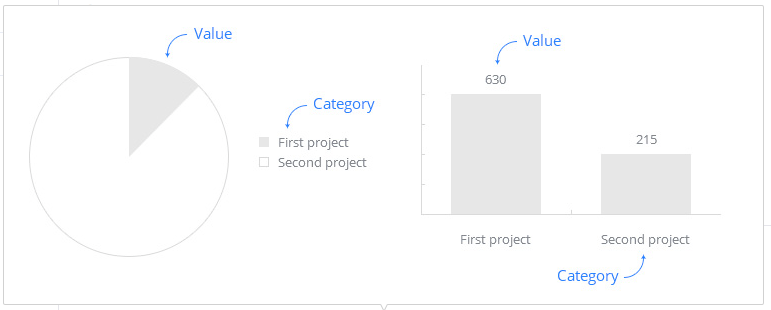
For both chart types you can specify a category and a value. The Metric report will display a single numeric value.
Other fields can be used as filters and hidden from a chart or metric.
Group, hide and aggregate functions
The new report designer allows you to hide certain field. This function is useful for the fields that act as filters.
Now you can also group displayed data by certain fields, e.g. show total budgets per portfolio.
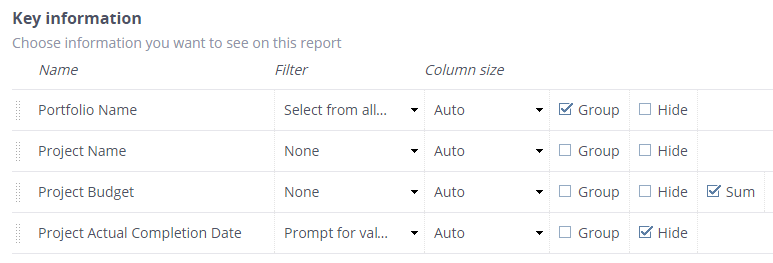
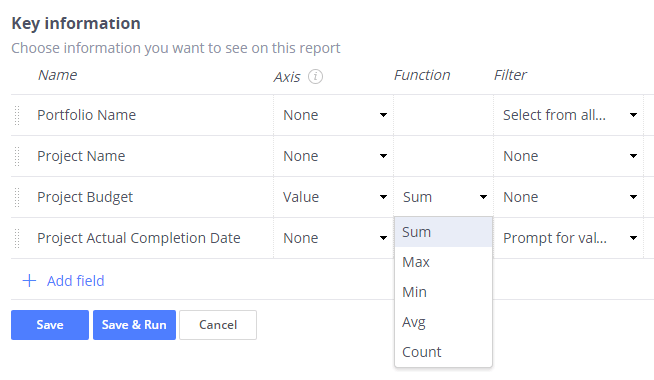
You can apply certain aggregate functions to the numeric fields on the Chart or Metric reports.
Publish reports to Dashboard
Probably the most exciting new function allows you to make any of the reports (table, chart or metric) available on the Dashboard.

Once published, this report will be available for anyone to choose from the “Available Widgets” dialog on the Dashboard page.
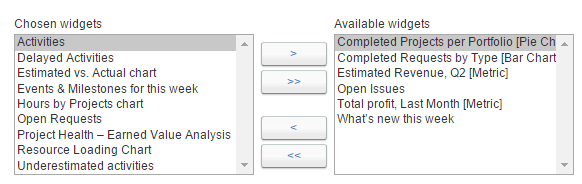
Of course, as with any report, each user will only see data they have access to.
We hope you enjoy this update. Keep tuned, as more exciting changes are coming soon.
As always, we′re looking forward to hearing your comments, ideas and suggestions.
Follow us
