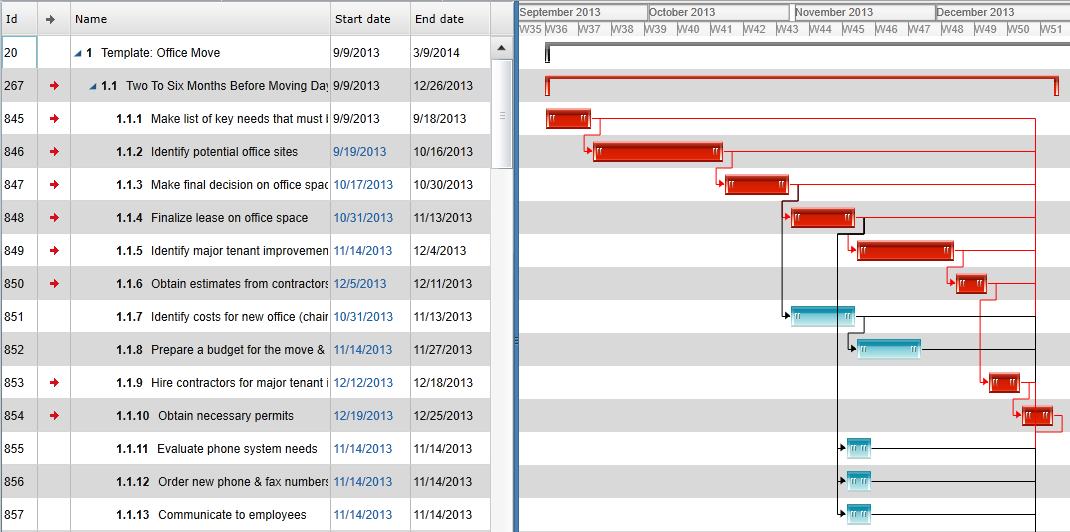
In this week’s video, we talk about one of the most fundamental cornerstones of project management, the Gantt chart. The Gantt chart is a visual representation of a project schedule, which shows all its tasks and their relationships as well as dependencies.
The Gantt chart is named so because it was invented by Henry Gantt in the 1910s. Gantt charts were also employed on major infrastructure projects including the Hoover Dam which was completed two years ahead of schedule. Some believe the use of a Gantt chart may have had something to do with it.
ADVANTAGES
There are several reasons why Gantt charts are still a popular option for project managers today:
Visual
Many people are visual thinkers and learners and need to get the big picture of how a project is structured. According to modern neuroscience, 65% of us are visual learners. Moreover, 90% of how we interact with and understand the world is through visual experiences and how most of us organize ourselves best.
Organization
Having visual leads to better organization and a better handle on the project
Project Tracking
Having the ability to track and visualize every step in the project with the respective assignee names helps keep people accountable for their part. When everyone can see how their part affects all other parts, the chance of slacking is much lower!
Gantt charts often use a variety of colors to help visualize and organize particular tasks. Putting the Gantt chart together is the job of the project manager who will coordinate to meet with everyone involved and come up with a game plan for what timelines would work best and what can realistically happen.
After that, he or she will assign the tasks and timelines to end up with the Gantt chart. Thanks to technology, we no longer have to actually map out project timelines on paper. We′re now able to have them automatically created for us based on our inputs. The best thing about this is that when using Gantt chart technology, it′s easier to recalculate project timelines easily.
Best Practices
Here are three ways to make sure that you are using a Gantt chart effectively.
Keep track of your progress
Having an up-to-date progress bar for all of your tasks on the Gantt will help you quickly see if you′re going to be on schedule. And if not – what other tasks are going to be affected.
Define a Critical Path
A critical path is a way to look at all activities in the Gantt chart and take into account the timing and dependent relationships of each and calculating the longest path from start to completion of the project. This will basically show you the stuff that′s “critical” vs tasks that can be delayed without risking making the project late.
Once you calculate your critical path – highlight the tasks on it. Or use project management software to do it for you.
Add Milestone Markers
Choose a symbol to represent milestones, that is, major events that either have a large part in the processor must be completed before progress can continue. Place them on the chart beneath the date or time when they occur. This is pretty cool because you′ll know just by looking at the chart when big important deadlines are.
Once you have all these key components – make the Gantt chart available for everyone to see. You can either print/email a copy once every few days to keep the progress updated or simply use a project management software with a built-in Gantt chart function.
Whether or not you decide to use Gantt charts depends on how you like to work and the complexity of your projects. The Gantt chart is not going to go anywhere anytime soon because as humans, we love visuals.
If you′ve never tried using a Gantt chart before, try inputting all your project data into your fav project management software to create a Gantt chart of an ongoing project. Print it out and see if you can spot any potential risks that need to be mitigated. Let us know how it goes!
Follow us
